
Unbalanced Forces Lab
Unbalanced Forces Lab
Grace Chung October 25, 2021
Partners: Moon Ding, Micheal Palumbo, and Ibrahim Khan

Hypotheses
For this experiment, we had two questions we had to answer, so two different experiments were required. The first question is how does the acceleration of an object depend on the net force acting on it. So, for this experiment, we changed the net force and saw how the acceleration changed. The second question we answered was how does the acceleration of an object depend on the mass? We changed the overall total mass for this experiment.
Variables
For the initial experiment, in order to change the net force, we altered the mass of the cart and the mass of the hanger retrospectively while also keeping the total mass the same. This is the independent variable, or the variable we purposely change. The dependent variable, or the variable that changes as a result, is the acceleration of the cart hanger system. The constant variables, or the variables we keep the same, are the same cart, the same track, the same planet, and the mass of the total system. For the second experiment, the independent variable was the total mass or changing specifically the mass of the cart while keeping the mass of the hanger the same. The dependent variable is the time it takes to fall down or the acceleration. The constants are the net force, the cart, the height of the hanger, the mass of the hanger, and the planet.

Developed Method and Procedure
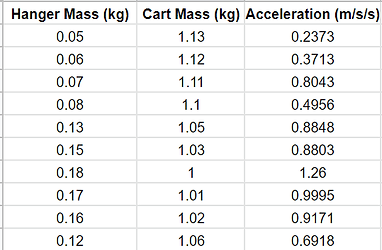
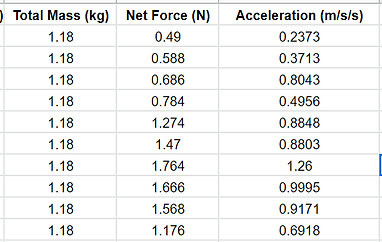
For the first experiment, we used weight washers and weights to alter each of the weights. We had a controlled weight, 1.18kg, and we kept the 1-kilogram weight on the cart while altering the 0.18 kg between the hanger and the cart. We used the motion sensor the calculate the slope of how fast the hanger falls of the velocity position graph and logged said acceleration into a chart compared to the net force of the hanger, which was calculated by using the hanger mass and multiplying it by the force of gravity. For the procedure, we placed the cart on the table and hung the hanger over the side of the table. We place the designated weights on either the hanger or cart and opened the Logger Pro Motion Sensor for each altered mass graph. We reopened a new graph for each trial, performing ten trials. After collecting the data, we put all the data into a Google Sheets graph, and then graphed a net force acceleration graph into Logger Pro.
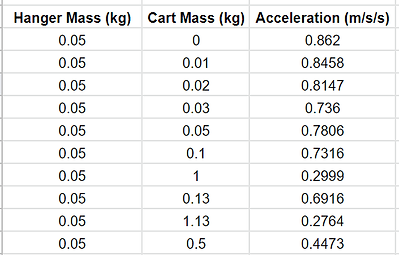
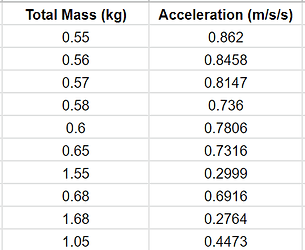
For the second experiment, we changed the overall total mass by only altering the mass of the cart. The mass of the cart without any weight was 0.5 kg, while the constant mass of the hanger was 0.05 kg. We changed the weights we placed on the cart mass, starting with 0 kg on the cart, and the max weight is 1.13 kg. We once again used a Motion Sensor along with Logger Pro and calculated the slope of a velocity-position graph. After calculating the acceleration graphs, we graph the total mass acceleration graph. For the procedure, we placed the cart on the table and put the hanger off the table. We started with the lowest cart weight, and slowly built our way up to the maximum cart weight. We used the Logger Pro Motion Sensor for each weight, for a total of ten trials.
Raw Data and Processed Data
Experiment 1 Experiment 2

Graphs
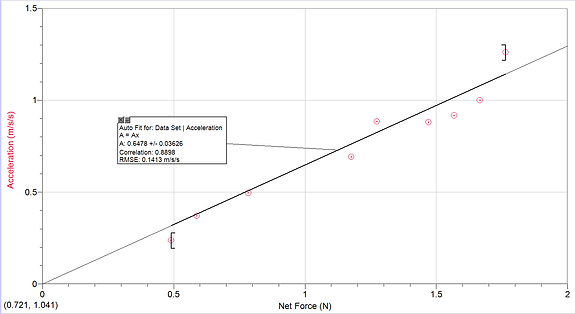
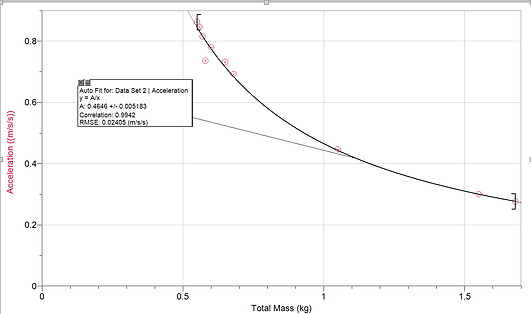
Experiment 1 Experiment 2

Drawing Conclusions
From these graphs, we can draw several conclusions about the relationship between acceleration and mass and acceleration and net force. The relationship between net force and acceleration is linearly increasing. As the net force increases, so does the acceleration of the object. On the other hand, the relationship between total mass and acceleration is exponentially decreasing. As total mass increases, the acceleration decreases. But as total mass increases, the difference between the acceleration points becomes smaller and smaller, making the graph shallower.
Conclusion
From this lab, we can see the relationships between acceleration and net force and acceleration and mass. We know graphically about these relationships, but know we can relate these relationships to real life. When calculating and solving any force problems, we know the acceleration will increase as the net force increases, convenient when comparing otherforces with each other and checking your work to see if it is correct. If the net force is greater than another net force, the acceleration of the first net force must be greater than the acceleration of the second net force. When talking to other groups, all of their graphs were linearly increasing and expontential for both experiments. The main question was for the second experiment was the graph technically exponential or an inverse. After some consideration, we decided it had to be inverse because exponential would curve back up and inverse would keep on decreasing down.


Evaluating Procedures and Improving the Investigation
The procedures were pretty straightforward, but there were definitely some errors according to the graph, which had some inconsistencies. These errors were due to human error, which impacted the the graph because we would stop the cart before the hanger hit the ground. We could've accidentally made some errors regarding when we would catch it, impacting the slope of the velocity-time graph, changing the final graph. Additionally, we could've had a larger range, making the graph more accurate. In order to improve the experiment in the future, we could be more careful and conduct several experiments for one weight, rather than only one experiment for one weight.