Unit 1 Content Page
This unit covers everything from kinematics to gravity to little battery-powered cars. We did several labs relating to time, velocity, and acceleration using time trials and different battery-powered objects to determine their speed and therefore acceleration.

Terminology
position: place where an object has been put, is a vector which involves direction, usually a number on the y-axis
displacement: object's overall change in position, how far away said object is from the starting point, usually the origin
distance: scalar quantity referring to how much ground an object has covered, object's overall change in position


Interpreting Time Position Graphs
In order to interpret time graphs, you must understand what they mean. These graphs show how much has changed in distance in a certain amount of time. The standard forms of measurement for these are seconds for time and meters for position. The line formed represents the velocity line, as velocity is in meters/sec, which is what the slope of this graph is in. For this specific graph, the initial position is y=3, making b (in the y = mx+b formula) equal three. We can calculate by calculating the change in y divided by the change of x. For this problem the equation is
(8-3)/(10-0), making the slope 5/10, simplified to 1/2 or 0.5. Therefore the velocity equation is X(position) = 0.5t(time)+3.


Interpreting Speed and Velocity to Position-Time Graphs
In order to interpret speed and velocity of position time graphs, we must the difference between speed and velocity. Speed is a scalar value, and is solely about the rate of position/time. Velocity is a vector, involving both direction and rate in order to be interpreted. For this specific graph (see above), both speed and velocity are constant because the function is linear, which doesn't always happen, especially if the function is quadratic. So the speed for this graph will be +/-0.5 m/s, while the velocity is +0.5 m/s.
Velocity-Time Graphs
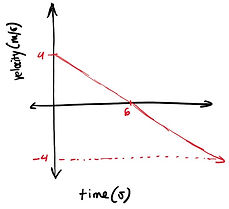
In order to interpret velocity-time graphs, we have to understand that this graph shows how velocity changes over time, not necessarily how to position changes. The slope created is the acceleration (m/s^2). For this specific graph, it is an overall negative slope. When the velocity reaches zero, the object comes to a complete stop, and starts moving backwards, hence the negative velocity. For this specific graph, the b is y=4, and the slope is consistent (2/3). the equation of this graph would be V=2/3t+4

Interpreting Acceleration, Starting Velocity, Distance, Position, and Displacement to Velocity-Time Graphs
Position, Displacement, and Distance
In order to find position from a velocity-time graph, in calculus terms, you can find the integral of the velocity-graph, which will give you the position-time graph. The position will be y = -1/3t^2+4t. In order to find the displacement and distance, you find the area under the curve, or the integral depending on how complex the function is. For the displacement, since you factor in the sign of the area, the displacement of this function will be 0 m because these two triangles are congruent, but one is negative and the other is positive, meaning they cancel each other out. For the distance, since you don't factor in sign, you find the area of one triangle and double it. The calculation is 2 * 1/2 * 4 * 6. The overall distance will be 24 m.
Acceleration and Starting Velocity
Finding starting velocity and acceleration on this velocity-time graph is relatively straightforward. In order to find the starting velocity, locate what the y is when x, or time = 0. For this graph, our starting velocity is 4 m/s. The acceleration is the slope of of the velocity time graph in m/s^2, because slope is delta y/delta x. For quadratics, it will be the a value. So, the acceleration of this graph is -2/3 m/s^2.
Connecting All the Graphs
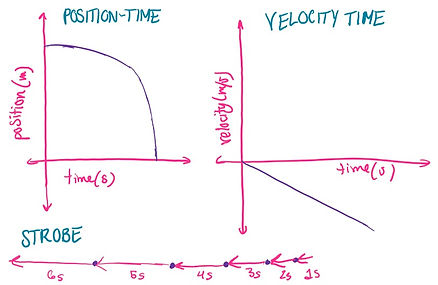
The position-time graph and the velocity-time graph are directly correlated, as the slope of tangent line of the position time graph determines the slope of the velocity-time graph. In this case, we see how a negatively increasing slope for the position time graph correlates with the velocity-time graph. The strobe conveys the increasing position, or position, or this graph. It goes to the left because it is negatively increasing, or getting steeper, so this distance between seconds gets significantly bigger as time passes.

Solving Problems
In order to solve any problems involoving velocity and consistent acceleration, I use 4 main formulas.

Projectile Motion
Projectiles are objects in the air with which gravity is the only force acting against it. The trajectory is the path of the projectile, in which has both a vertical and horizontal launch. Horizontal launch has no horizontal acceleration. Vertical launch's acceleration is -g (gravity), and the initial velocity is zero.
